
http://www.dressagedetective.com/
The coolest website ever. You can look up dressage judges and see what their average scoring was, the analyst also ranked every judge by generosity and popularity. Look up Axel Steiner and feel bad for anyone who has to ride in front of him (he's an excellent judge but look at the generosity ranking!).
The facebook page has a lot of cool stuff posted (from the website)- such as the most popular breeds at each level and finding out that Friesians score better than Swedish Warmbloods at First level.
This is so cool, and this is also time to talk about my horse related data science project.
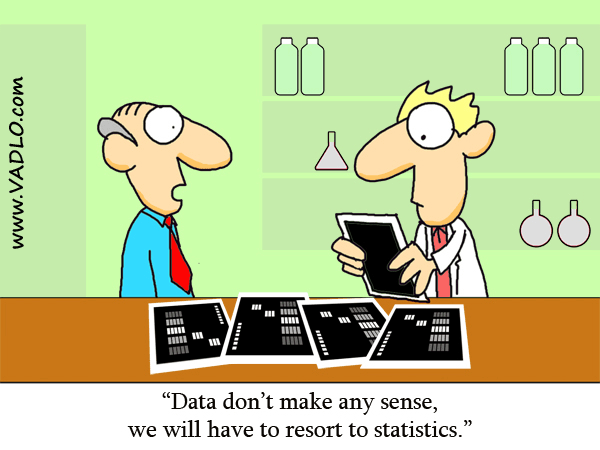 |
| Enjoy some data cartoons |
I decided to do a side project because
Heidi and I were talking one day about school and I said that I loved statistics because I'm a nerd and she said she loved statistics too when she was in college! She described a project she did- taking information about the horses that she and her mom sold and creating a formula of sorts to decide how much the horses were worth, taking into account age, breed, level of training, show record, etc.
I was like oh so using a stepwise MRC to create a regression formula? YES SO COOL OMG.

After drooling over that project idea, I decided to replicate it, but using data from dreamhorse.com. Dreamhorse gives you age, breed, gender, height, temperament, and price, and the description usually states level of training, level of showing, and who the horse is suitable for. YES dreamhorse isn't actually an accurate depiction of what horses are selling for and instead I can only look at what horses are being priced at but I don't have access to that kind of data.
So I'm in data collection right now, I have 55 horses in a CSV file. I'm writing my R script as I go so I can quickly spit out descriptives and a few MRCs (I'm treating it like exploratory data analysis so I'm just fucking around a bit). My end goal is to determine what factors (as in age, breed, height, level of showing, etc) affect the horse's price. I can analyze the variance explained by each factor, giving me a strength of sorts for each factor.
Obviously we can speculate what the results may say- it is likely that the level of showing/training the horse has explains quite a bit of the variance in price with the higher level horses being more expensive. It's also likely that warmbloods might be more expensive than the other breeds.
 |
| He sure looks expensive |
The interesting thing about MRC is that you can also take into account overlap. For example, I want to see how much overlap there is between breed and temperament. I bet there's a relationship between the hotter breeds and a higher number under temperament. I can quantify that relationship.
Once as I have all my data (currently learning how to get python to scrape dreamhorse for me so data collection goes faster), I can start messing around even more. Right now is all about gathering as much data as I can.
 |
| Yep |
Don't judge me on my nerdiness, it has got to be contagious. My entire house (me, boyfriend, and two roommates, all of us in the same grad program) is running a statistics project using a game that we play regularly (Settlers of Catan, highly recommended even if you don't obsess over statistics while playing it). Also boyfriend and I have been talking briefly about doing some text analysis with twitter posts. I'm not the only one! I am, however, the only one sitting downstairs arguing with powershell while I enjoy some tea.
This afternoon I'm going to see if I can ride little TC again, and on Friday Ali wants me to ride him on a trail ride with her off the property! I'm excited, although it has been a while since I rode such a greenie out and about (although TC has had a lot of trail experience so it should be fine). Looking forward to it, although Rico is for sure my favorite trail horse.
 |
| The best! |

Woooooooooooow!!! *mind blown*
ReplyDeleteI'm excited!
DeleteThat is legitimately the most awesome thing ever. So cool. I wanna be like you when I grow up! :P Good luck on the trails!
ReplyDeleteI definitely have Heidi to thank for the original project! Now I just need to get my spiders working so that I can collect data at a faster pace and actually have results to share!
DeleteSounds like a ton of fun! Make sure to share the results!
ReplyDeleteDefinitely! There will be at least a blog post or two about them once I'm done :)
DeleteOMG YES DATA. I loves me all the data about all the things. Stats are amazing once you can wrap your head around them - it's like you can force the data to tell you all it's little secrets. Muahahahaha! I can't wait to hear what you find out!
ReplyDeleteHaha I knew you'd like this! I'm so excited about this project, I won't stop talking about it and it's probably going to become a problem fairly soon.
DeleteSuper interested to hear about breed bias in pricing. I've noticed that TBs are usually priced far lower than warmbloods of a similar age and level of training (I'm talking upper level schoolmasters only here). Interested if that's just something I've noticed, or of its true with a wider sampling.
ReplyDeleteLove that site with the judge info. I've used it once to decide between two shows based on judges. Worked out for me!
Yeah I'm really interested to see how much breed matters when it comes to pricing. Even with my limited data set, young warmbloods go for a LOT more than young TBs. Will be really interesting to see if we can quantify that.
DeleteSooo nerdy! I love it. I used a ton of R in undergrad and to be honest, stats made so much more sense to me than the "other" maths. You must share the results! :)
ReplyDeleteI've always been a bit of a math person and actually preferred calculus to statistics but once as I took stats in graduate school and it was more than just doing t-tests, I was hooked! I've always loved programming (from afar, I'm only now jumping into it) so R was super fun to learn.
DeleteMy youngest sis is big into statistics, me not so much - numbers, facts & figures tend to go in one ear and out the other if math is involved for me. However I love reading data collected & processed by others. Plus graphs & pie charts always make for fun viewing ☺
ReplyDeleteHope you have a ball trail riding with TC
I will for sure be doing some interesting graphs (especially because it's for a portfolio so it needs to look pretty), hopefully I can post all of the results here!
Deletei LOVE this!!! will be super excited to see your findings!! also curious if you're going to consider technically superficial characteristics like color and whether there were pictures... fun fun fun!
ReplyDeleteI do have color in there, I don't have pictures, although almost all of the dreamhorse ads I've come across have pictures.
DeleteThe variables I'm collecting are: age, breed, height, temperament, level of training, level of showing, type of shows (unrecognized, recognized, etc), and whether the horse is suitable for a child, junior/timid amateur, young rider/strong amateur, or professional. I'm sticking with non-gaited breeds specifically being sold as dressage horses (as in, no horses who are actually event/jumper horses but *could* be dressage horses since they're priced differently) and all of them are in California because our market is a bit inflated.
If I can get my spiders to do it, I might eventually grab all disciplines across the country but that's ambitious...
hmm regardless it sounds like an excellent starting point and i will be super curious about the results. hey, who knows - if the project works out well enough maybe you can capitalize on it by designing a pricing tool for people trying to sell their horses? or consult on optimizing sales ads?? lol...
DeleteTHIS IS AWESOME! I love it! I'm a numbers nerd too, anything along these lines that you post will be interesting to me.
ReplyDeleteYesss numbers! I'm excited to see what I find and share it here :)
DeleteTHIS IS BADASSERY AND I LOVE IT. I am a total R novice for data management/manipulation, but I too use regression analyses for my thesis. What we SHOULD do is also query people we know and see what horses were listed for vs. what they actually bought/sold for, and take that into account! A much smaller dataset, buuuuut also very revealing!!
ReplyDeleteSoooo sorry for just shouldering in on your project like that. I got really excited. I cannot wait to see your results though. :)
Ahh I know I wish I had access to the numbers that horses were sold at! Unfortunately dreamhorse doesn't post that so I'm stuck with a convenient sample. I am getting some cool results, I rewrote my R script today so I have all my descriptives, zero order correlations, and the first two standard MRC analyses that I'm running. Even with 68 participants so far, I have quite decent p values. Lots of multicollinearity though so I'll have to tease apart certain factors. And more data, lots more data! I'll for sure post something with all the final stats!
Delete