
Sorry in advance about how weird this post is. I like turning dressage/horses into math. What a way to ruin a Friday, right? Happy Friday! HERE IS MATH.
Regression toward the mean is a concept in statistics (thanks wikipedia): if your variable is extreme on the first measurement, it will be closer to the average on the second measurement; if your variable is extreme on the second measurement, it will have been closer to the average on the first measurement. Basically when you have an extreme score, you're almost always going to regress toward the mean after that score, because the likelihood that you continue to score extreme scores is low.
Who likes statistics (ahem) though? Let's talk about dressage, a subject just as dry and technical, but there are ponies.
 |
| Ponies make everything more interesting |
Let's say you're going to ride a dressage test every day for a year. Let's also put unrealistic limitations on basically everything because fuck realism
Also for the record, this judge is always going to be in the same mood, be healthy, and will not get bored with judging the same test with the same rider and same horse every fucking day. The footing, weather, and location is all held constant too, no new spooky things. You're feeding your horse the same thing, your horse never gets hurt or sick. Basically every single thing is constant except the way the test goes each day, which is dependent completely upon your abilities right now.
Over the course of the year, all of your rides average out to 65%. But did you score exactly 65% on all of them? Probably not. You probably did something like this:
 |
| Okay this is just cute, have a better graph |
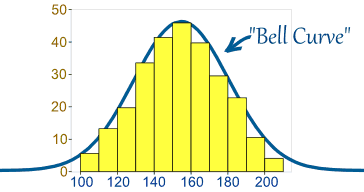 |
| "Laser" So imagine instead of 150 in the middle, it said 65%, this graph says that you scored 65% 45 times over the year, you scored at 64% 40 times, 63% 32 times (or so) and so on. |
The y axis is the frequency of tests. The x axis is your score. Right under the middle of the ghost's head, is 65%, to the left is the 50s and the right is the 70s. Most of your scores are at/near the 65% mark and then they taper down. This means that over the course of the year, you probably scored a whole lot between 63 and 67 if your average score is 65%, but you scored less frequently over the year at 60 and 70. Even less at 55 and 75. It's unlikely that you scored 50% or 80%.
So yeah, sometimes, you'll score 65%. Other times, you'll have a bad day, maybe your timing was off or maybe your horse picked up the wrong lead. All normal mistakes for your level of training, but a combination of all of your minor issues led you to earn a 56%. That's unfortunate. But then one day you have a great test, everything falls into place, you make no mistakes, your horse is feeling good, and you get a 74%. Then you have a pretty good test and that drops to 68%. Then you have another not too great one and it drops down to 62%.
 |
| Maybe one day we'll think that a bad score is 62 haha |
Over and over you ride this test. By the end of a year, you're bored to death (but the judge is still happy since we held that constant, maybe we should have held your happiness constant so you wouldn't complain so much), but you have an excellent understanding of where you stand. Your high score of 74% and your low score of 56% don't necessarily define your current ability (perhaps your ability on a really good day or a really bad day), your average score of 65% does.
But not very many of us have the means to ride the same test 365 times just to see where we're at. In addition, we are constantly trying to improve ourselves, showing at different venues, showing in different footing, showing under different judges, having minor and major setbacks due to injury, sickness, etc. So how do we really know how we're doing? We have to kind of guess based on our scores, and back to my original point, our rides.
 |
| So much of this sport is guessing, like guessing what color this weird horse is |
Alright, so back in the real world, you go out to a show and score 76%. Holy shit! You're AMAZING. At your next show, you score 65%. Oh... what a let down in comparison. Also, evidence for anchoring, where you hold onto the first piece of information you receive but we're not talking about psychology right now.
BUT, without riding all those hypothetical tests, we don't know what our normal distribution is (and yes I mean it could be NOT a normal distribution, THE HORROR) and we have no idea what our average is. Perhaps we had an extreme score on that first ride. Just a totally randomly high score, great, but probably not reflective of where we really are, we're really closer to 67% maybe, or 65%.
Perhaps though, we had an extreme score on our second ride, an extremely bad score (who calls a 65% a bad score?? Perhaps someone who normally scores 76%?), and that the 76% is actually where we stand. How do we know? We just need to show more! But what about all those nuisance variables? I... I... why isn't the real world like a laboratory?!
 |
| Please do not put me in a laboratory |
So anyway, having good and bad rides always makes me think about this. Every time I have a good ride with TC, I can't tell whether we're having a ride that would be considered an outlier- a particularly good ride that isn't any indication of where we are, it just happened by chance OR whether we're actually progressing. Only over time, by riding that damn test every day (or, you know, being a normal person and just riding) will it become apparent whether that day was indicative of where we were at or whether it was just a chance good day.
And by the time we realize what that particularly good ride was, we've probably had another particularly good or bad ride that we were left guessing about. Riding horses is fun!
 |
| And ponies make statistics better! |
By the way, if anyone had trouble with the way that statistical tests work and for some reason feel like learning a bit more now, keep reading! Statistical tests are designed to calculate whether or not your horse scored that high due to chance, or whether it was because your horse is simply awesome (we kind of have to imply the awesome part).
Let's say you want to know whether your horse is what we'll call an average dressage horse. Let's say you think that an average dressage horse's scores will be 65%, so you put that in the middle of your distribution. You then take your horse to a dressage show and score 80%. Is your horse an average dressage horse that had a great test? Or an above average dressage horse who had a decent test? You can calculate the chance that you, on a horse you assume scores 65%, will score excessively high, like 80%. Perhaps that happens only once in every hundred tests that you ride if you are truly riding a 65% horse.
BUT that score is so high that since you actually managed to score it, you're starting to think that maybe you're not on an average horse. I mean, what horse who normally scores 65% scores 80% just randomly? It'd be more plausible that your horse ACTUALLY has an average score of 75%, where it'd be a lot more plausible to score 80%.
There's only a 1% chance that a 65% horse will score 80%, but there's a much higher chance that a 75% horse will score 80%. So, when your presumed 65% horse scores 80%, it's probably not a 65% horse.
p = .01
Statistical tests won't tell you whether your horse is indeed a 75% horse, but they will tell you that it's so highly unlikely that your horse is a 65% horse, that you can conclude that your horse is NOT a 65% horse.
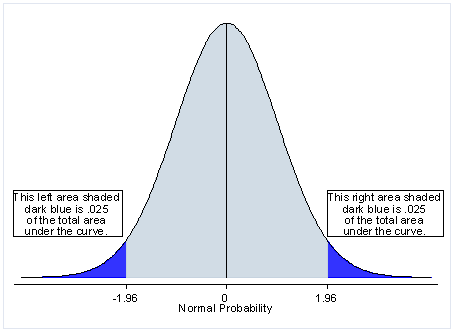 |
| We can basically say that if you score in the dark blue regions, you probably just drew the graph wrong rather than have a horse that scores at 65% score 80% because the odds are so low |
This also applies to treatment effects. Say you have a current 65% horse, you apply training (treatment), then you test the horse again and they score 80%. Because it's so highly unlikely that a 65% horse would score at 80%, you can conclude that your training produced a statistically significant improvement in the horse's scores.
p = .01

OMG HEART THIS POST. I love math, statistics, dressage and horses. I majored in Actuarial Science (business oriented math/stat) and have a Statistics minor.
ReplyDeleteYou made my Friday!
YAY! I'm glad you liked it, I was worried. But it was probably the most fun I've had writing a post in a long time. I love applying statistics to horses, especially when we can throw realism out the window and make up ridiculously controlled laboratory experiments like riding a test every day.
DeleteI absolutely love your blog. You always give me things to think about, plus who doesn't want to pretend life is one big experiment and we can control all the variables.
ReplyDeleteThanks!! I love thinking about stuff like this, especially after a bad ride. It's easy to let a bad ride get me down but then I just think about statistics and it makes me feel better haha plus the crazy experiments make everything better.
DeleteOh man I love number so much! And stats are so fun, although IMO Haffie Math is the best (two Haffies make a whole, two quarter horses = one Haffie, etc.)
ReplyDeleteNow I wonder how many times I've ridden Tr2 and Tr3. Because it feels like way more than 365. Which brings me to another good point... why don't I ride my tests every day? Or maybe ride them backwards. Or ride half the test. I'd probably do a lot better... hmmm... well I do have a month before regionals. New plan! Statistically speaking, maybe it will improve my average?
Also, please nothing paranormal in the dressage ring. We have enough problems with perfectly normal things, TYVM.
Haffie math is awesome!
DeleteI always forget about test riding except like the ride before the show. It's so good to do though! Rico has done enough tests to be pretty good at just winging it, but TC is not used to the whole centerline-halt-stand-still-trot-off thing just yet, I should do more tests with him.
And yes, no paranormal distributions in the dressage ring!
hahahaha @ "laser" (is that a dr evil joke or am i just making things up at this point?!?)
ReplyDeleteseriously tho, i definitely think about my tests like this. just bc we got an 8 on a canter depart on a recent test (fucking awesome) doesn't mean my canter departs are actually 8s now. but it might be indicative that i'm moving the needle in the right direction - that the mean might be closer to 6 now vs 5. and this theory also came in super handy when i went from scoring my personal best (a 26) to scoring my personal worst (45) in a mere two weeks haha. somewhere in between there is a perfectly respectable 35.
Definitely a Dr Evil joke, I really had to do it after seeing "Bell Curve" in quotes!
DeleteI was totally thinking of those tests that you rode when I was writing this too. And how many nuisance variables come into play to lower a score or raise one. Just in a matter of two weeks we can go from best to worst scores and it's not like the horse has just suddenly gotten terrible over those weeks (hopefully not). So many variables at play. It's fun to think of a world where we could actually find out exactly where we are. But for now we can just guess at it!
omg. bc i am a freak, i just went back and tabulated each of my movement scores through different tests over time. to measure the averages. plus spark lines bc obvi. ha. post to come :)
DeleteOmg YES that post can't come soon enough.
DeleteI've always wanted to figure out some way of predicting my performance at shows using my rides at home. The problem is that my at home rides are not judged. Maybe one day I can hire a judge to give me scores on every single thing I do and then I can use those home scores to predict show scores taking into account different judges/venues/etc and I can use my previous show scores to calculate how stress/tension may depress scores (ooo and maybe this varies based on venue). But I don't have the means to do that just yet. Still having a formula set up to give me a confidence interval on what I may score at any given show taking into account how I've been riding at home, the venue, the judge, and even the weather, would be AWESOME.
it *would* be awesome to be scored at home... and to also see how scores might change from venue to venue. i only have 10 tests to analyze (post is written and will be out tomorrow btw haha) so the data is maybe a little too granular to get to that level of detail... but even just considering scores from shows still gives me a lot of insights about schooling. anyway i just love this idea hahaha
DeleteThis was awesome because I understood things which is awesome because maybe I did, in fact, learn something in my first year of grad school which means I didn't just light $45,000 on fire.
ReplyDeleteYay for learning something at grad school! Most of what I learned in grad school only sticks around if I put it into pony terms.
Delete:O
ReplyDeleteMy brain hurts now.
I hear (and know from experience) that statistics-induced brain hurting is normal.
DeleteIn a very simplistic way I think of this when I ride. I did do statistics in grad school but it wasn't something that I was particularly interested in. However, I do wonder when I have a really great ride suddenly if it was an outlier or not. Then if my next ride is just as good or nearly as good I know it's that much more likely that I'm actually experiencing improvement or if it gets sad again then I know it was more of an outlier.
ReplyDeleteI'm about to statistics the shit out of all my dressage tests. STUDENTS T TEST HERE WE COME!
ReplyDelete(also, can I just say how I HEART such an easy stat to do?!?!)
I stumbled on this post by accident. But it was really cool because just this week I decided to start collecting data so I could figure out where we were.
ReplyDeleteI feel better that I'm not the only dressage rider who loves statistics.....